

Every module before this one ends the same way. Here is the work, here is what it moves, and here is the number that will not move no matter how well you do it.
That thread has been running through the whole set without ever being picked up. Module 06 said the technical work will not change your ranking for your own store name. Module 07 said link building is the hardest thing in the programme to attribute. Module 08 said the qualification page can never be tied to a first purchase.
All three are true, and stated separately they sound like excuses. Stated together they are the actual subject: on a dispensary account, most of what you can measure easily is not what the work moves, and most of what the work moves is awkward to measure.
This module is about closing that gap honestly. What the platforms actually know, what they cannot see, which four numbers belong in a monthly report, and what to refuse to promise before somebody asks you to promise it.
It is the least glamorous module in the set and the one that keeps the other eight funded past month four. In cannabis SEO consulting specifically, where paid channels are closed and organic carries the entire weight, a report nobody believes ends the engagement faster than bad work does.
Everyone is checking the wrong number
Two numbers dominate the conversation on almost every account, and neither of them responds to the work.
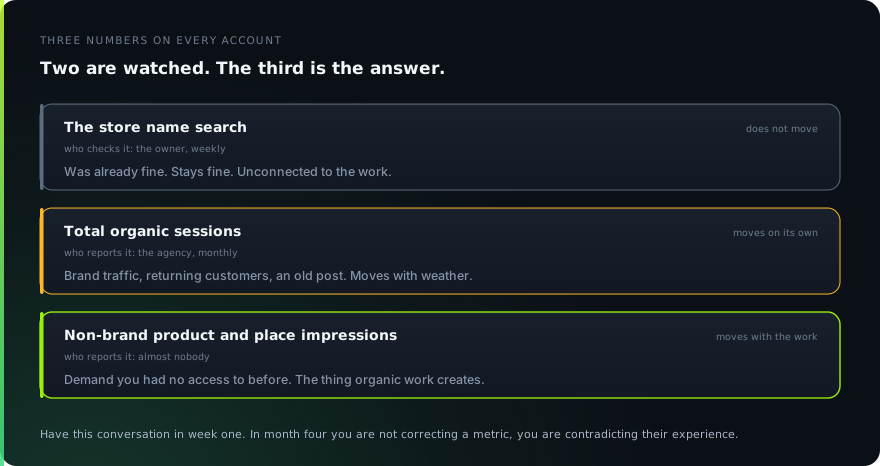
The owner checks the store name. They search it on a Tuesday, they are first, and they conclude things are fine. Or a competitor’s ad appears above it and they conclude things are broken. Neither conclusion is connected to anything you did.
A brand search was already going to find you. That result is the most stable thing on the account and the least informative, which is a bad combination for the number an owner checks weekly.
The agency reports total organic sessions. On a dispensary site that figure is mostly returning customers typing the brand, plus whatever the menu pages happen to be doing, plus a blog post from two years ago that ranks for something irrelevant.
It moves with weather, holidays, a competitor opening, a price change and a platform update. It is a real number, it is just not a measurement of anybody’s work.
The number that responds is narrower and duller: impressions on non-brand searches that combine a product or category with a place, plus the profile’s own interaction counts. That is the demand you were not in before, which is the only thing organic work actually creates.
Which means the reporting conversation has to happen in the first week, not the fourth month. If the owner has been checking their store name for six months before anybody explains this, you are not correcting a metric. You are contradicting their experience.
What Search Console actually knows about a local business
This is the fact that reframes everything else, it is stated plainly in Google’s own documentation, and almost nobody working on local accounts has read it.
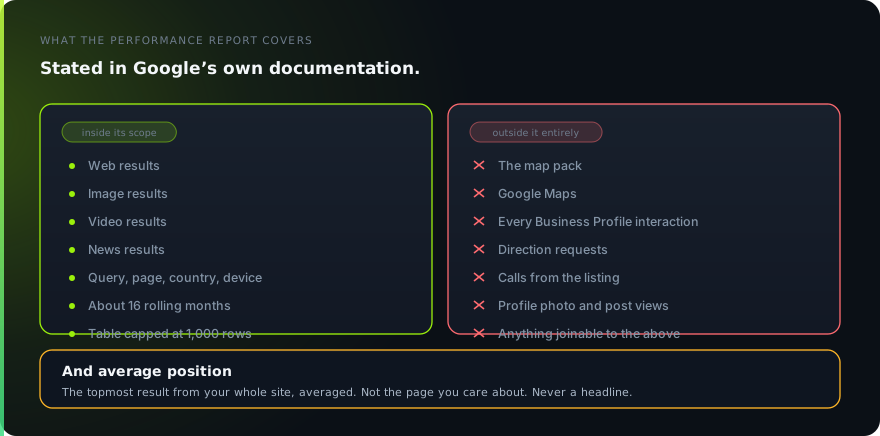
Google’s documentation states the scope of the performance report directly. It covers web, image, video and news results. The map pack, Maps itself, and every interaction with your Business Profile are not in it and never have been.
For an ordinary website that is a footnote. For a dispensary, where a large share of discovery happens inside the pack without a website result being involved at all, it means Search Console is showing you a partial view and labelling it as your search performance.
The second thing worth knowing is how average position is defined. Google describes it as the position of the topmost result from your site, averaged across impressions. Not the position of the page you care about.
So on a query where your location page sits eighth and an old blog post sits fourth, your average position is four. The number is accurate and it is describing something you did not ask about, which is why it should never be a headline in a report.
Two practical limits follow. History runs about sixteen months on a rolling basis, so the month you are looking at now will be gone in a year and a half. And the table caps at a thousand rows, which sounds generous until you filter by page on a fifty store site.
None of this makes the tool less useful. It makes it a tool with a defined scope, which is a different thing from the complete picture, and treating it as the complete picture is the most common measurement error on local accounts.
The map pack is a surface, not a position
The other half of the picture has a stranger problem. There is no single number to report, because the thing being measured genuinely does not have one value.
Module 01 makes that point from the proximity side, which is where it explains why you rank where you do. Here it is a reporting problem: what goes in the row.
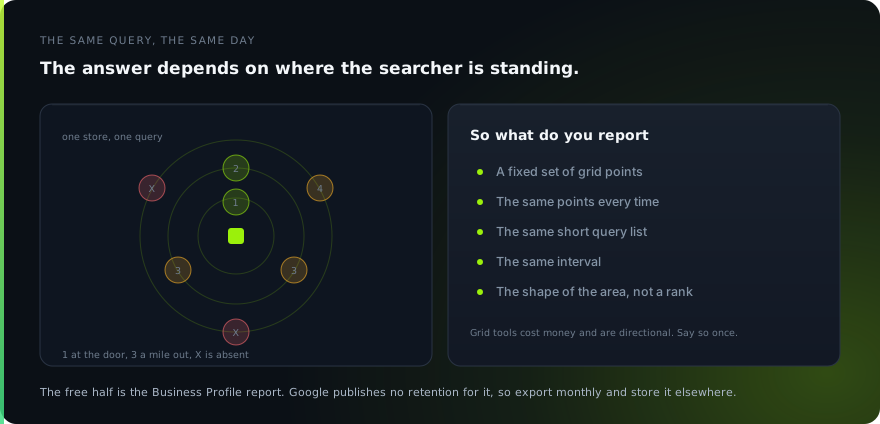
Your position in the pack changes with the searcher’s location, continuously. First outside the door, third a mile away, absent three miles out. All of those are true at the same moment, which means a single reported rank is a choice of location dressed up as a measurement.
What can be reported honestly is presence across a grid. A fixed set of points around the store, the same points every time, at the same interval, for the same short list of queries. What you are watching is the shape of the area you appear in, not a number.
Grid tools cost money and their numbers are directional rather than exact, which is worth saying to a client once rather than pretending otherwise. What they are genuinely good at is showing an area growing or shrinking over months, and that is the thing prominence work moves.
It also explains the pattern that produces most of the confusion on these accounts, which is how much of the pack proximity has already decided before any of your work gets a vote. A grid makes that visible instead of arguable.
The free half of this is the Business Profile performance report: searches, views, direction requests, calls, website clicks, and the rest. Those are real interactions with real intent behind them, and they are the closest thing to a conversion metric this industry has.
One catch worth building a habit around. Google does not publish how long it keeps that data, and the searches figure updates monthly and can lag by several days. Export it every month, to somewhere that is not Google, and stop assuming it will be there.
Query sets, which is the only way Search Console becomes useful
Within its scope, Search Console holds the most useful data on the account. The reason it usually produces nothing is that people read rows, and no individual row on a local account means anything.
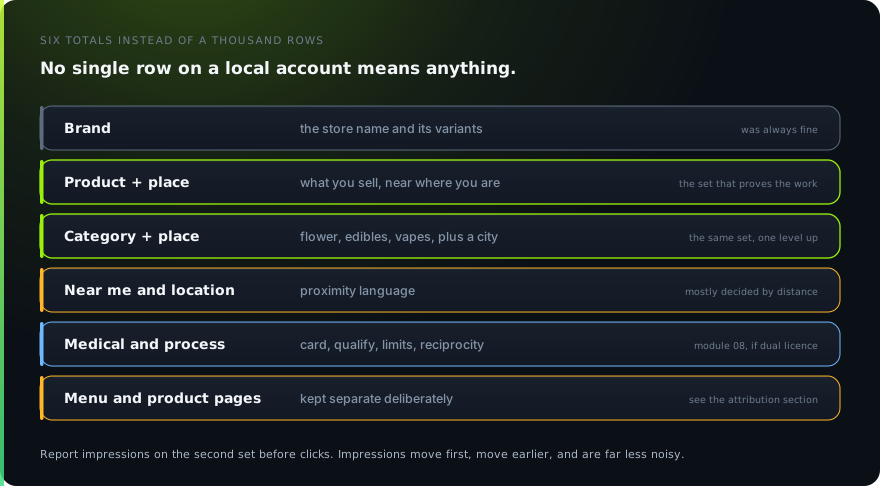
One query moving from position nine to position six tells you nothing. Forty queries in the same category moving together tells you something happened, and that is the unit you should be reporting in.
Build the sets once and reuse them forever. Brand. Product plus place. Category plus place. Near me and location terms. The medical and process language from module 08, if the store is dual licence. And menu or product page terms, kept separate for the reason in the next section.
The mechanics are boring and take an afternoon. A regular expression filter in the performance report for each set, or an export into a sheet with a classifier column. Either works, and the sheet version survives the thousand row cap by exporting in slices.
The set that proves the work is product and place, excluding brand and excluding menu URLs. That is somebody searching for something you sell, near somewhere you are, without knowing your name. Growth there is demand you did not previously have access to.
Report impressions on that set before clicks. Impressions move first, they move earlier, and on a set with real volume they are far less noisy. Clicks follow when position improves enough to matter, which is usually a month or two behind.
The menu, and why that traffic never attributes
Every dispensary account eventually reaches the question of how much money organic search made, and on most of them the honest answer is that it cannot be calculated.
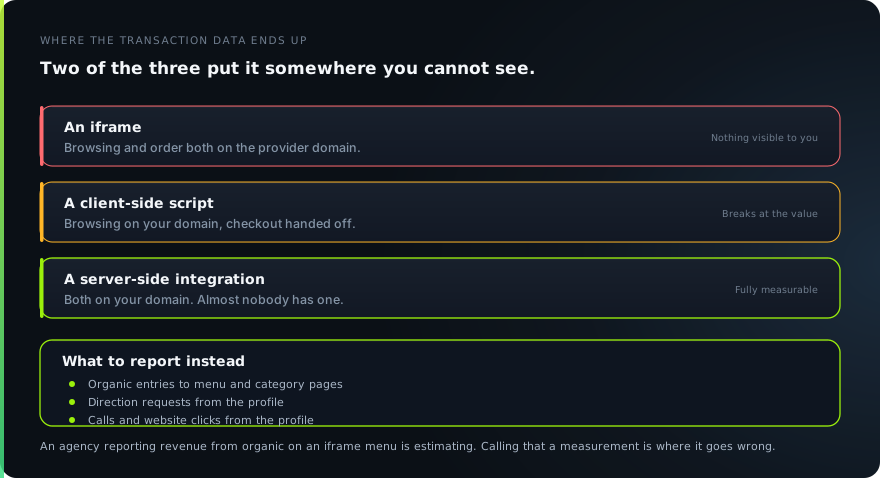
Module 06 covered the three ways a menu reaches a page. The measurement consequence is the part that module deliberately left alone, and it decides what a report can truthfully contain.
If the menu is an iframe served from the provider’s domain, the browsing and the order both happen on their property. Your analytics sees somebody arrive on a page and then stop, and it has no way to know whether that was a bounce or a four hundred dollar basket.
A client-side integration keeps the browsing on your domain, which is better, and then usually hands the checkout to a third party anyway. The session breaks at exactly the moment the value appears.
So when an agency reports revenue from organic on an account like this, they are estimating and generally not saying so. The estimate can be reasonable. Presenting it as a measurement is where it becomes a problem, usually about the time somebody compares it to the point of sale figures.
What you can report instead is a set of proxies that are actually measured. Organic entries to menu and category pages. Direction requests, calls and website clicks from the profile. Those are real counts of people doing something with intent, and none of them requires a claim you cannot support.
Before any of that means anything, it is worth counting how much of the menu is reachable at all, because a proxy built on menu page entries is worthless if the menu pages are not in the index in the first place.
Four things that break analytics on a dispensary site
Beyond the menu, this category has four specific ways of corrupting its own analytics, and all four are invisible unless you go looking.
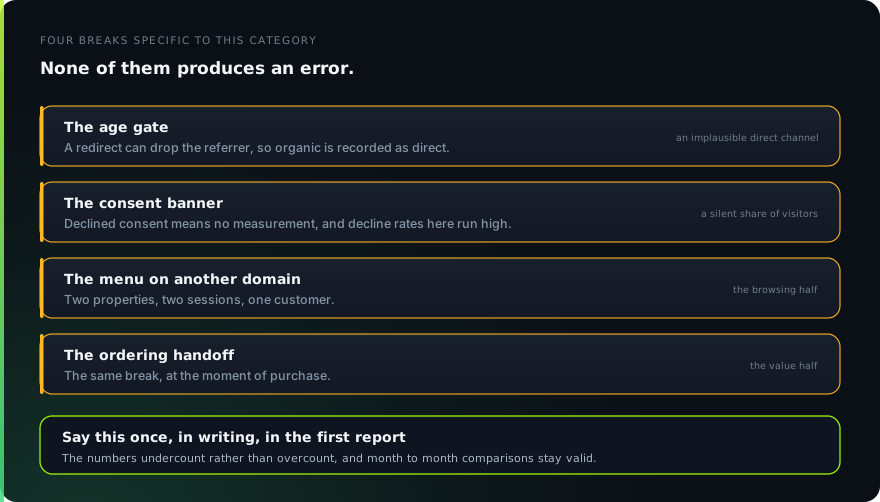
- The age gate. If it is implemented as a redirect to a separate URL, the referrer can be lost on the way back, and the session gets recorded as direct. A site with an implausibly large direct channel usually has this rather than a loyal audience.
- The consent banner. Declined consent means no measurement, and decline rates in this category run higher than most. Whatever share of your visitors decline is a share your reports do not contain at all.
- The menu on another domain. Covered above. Two properties, two sessions, one customer.
- The ordering or delivery handoff. The same break, at the moment of purchase rather than at the moment of browsing.
The correct response is not to fix all four, because two of them are compliance requirements and one is a platform decision. It is to know the size of each gap and to say so once, in writing, at the start.
A sentence in the first report saves an argument in the sixth. The numbers here are directionally useful and absolutely wrong, they undercount rather than overcount, and comparisons across months are valid because the same distortion applies to both.
One more thing worth checking rather than assuming, because it is stated wrongly constantly. In analytics, the retention setting on a standard property governs how far back you can build explorations, and it does not delete the standard aggregated reports. Those two are frequently confused, usually in the direction of panic.
The baseline you cannot recreate later
Every platform in this stack forgets. Search Console rolls off after about sixteen months. The Business Profile report has no published retention at all. Analytics explorations are bounded by a setting somebody chose once and never revisited.
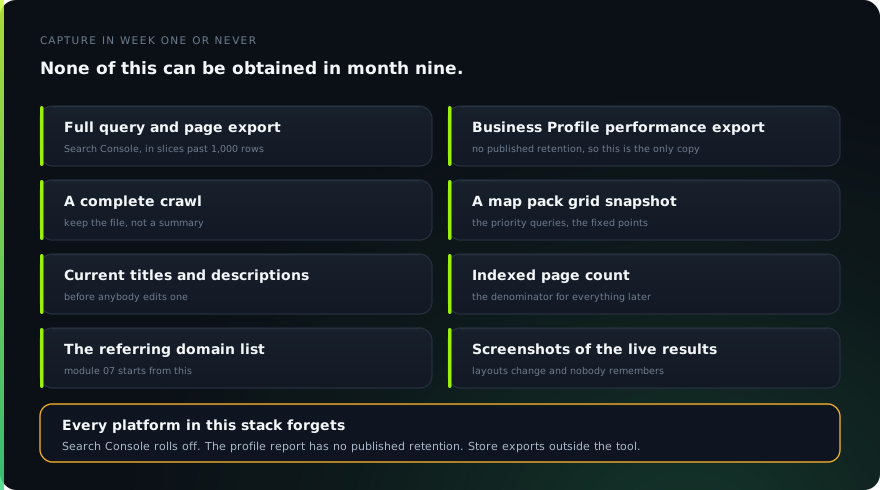
Which means the baseline is a one-time opportunity. Miss it and the question “what did it look like before we started” has no answer for the rest of the engagement, and that question always gets asked, usually by somebody who was not in the original meeting.
Take an afternoon in the first week. Export the full query and page data from Search Console, in slices if the row cap gets in the way. Export the Business Profile performance data. Run a complete crawl and keep the file.
Take a grid snapshot for the priority queries, save the current title tags and meta descriptions, record the indexed page count, and pull the referring domain list so module 07’s work has a starting point.
The step that feels unnecessary
Then the step that feels unnecessary and repeatedly is not: screenshot the actual search results for your top ten queries. Layouts change, competitors appear, features arrive and vanish, and in a year nobody will remember what that page looked like.
Store all of it somewhere that is not the platform it came from. The point of a baseline is that it survives independently of the tool that generated it, and a folder of exports has outlasted several analytics migrations on accounts I would rather not have had to reconstruct.
Real movement, seasonality, a SERP change, or noise
A chart moved. Before anybody explains why, it is worth being clear that there are four possible causes and only one of them is the work.
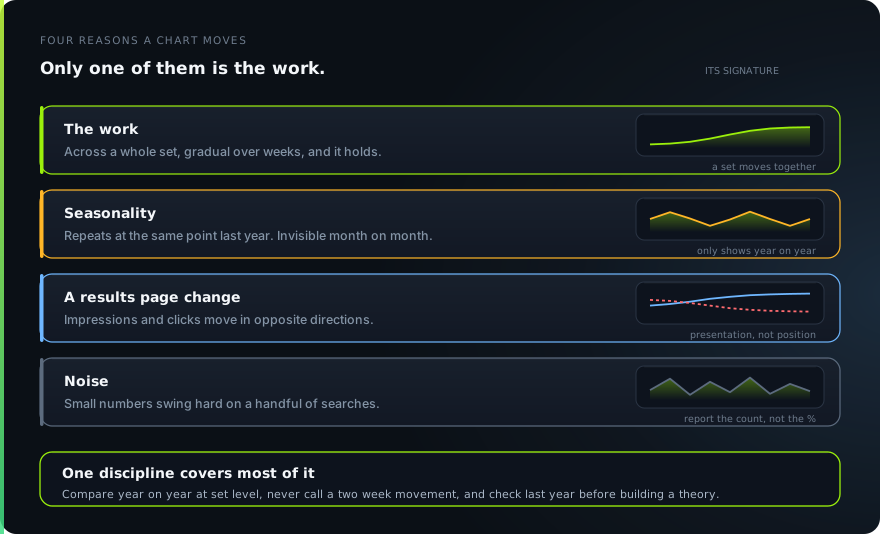
The work has a signature. It shows up across a whole query set rather than in a few rows, it appears gradually over weeks, and it holds. A single query jumping ten places overnight is almost never the article you published on Tuesday.
Seasonality has a signature too, and it is only visible in a year on year comparison. This category has holidays, weather effects and payday patterns, and a month on month chart will attribute every one of them to whoever last touched the site.
A results page change is the one people miss most often. Impressions rise while clicks fall, or the reverse, because the page around your result changed rather than your result. A new feature, a pack expanding, a competitor’s listing appearing above yours.
When impressions and clicks move in opposite directions, the cause is nearly always presentation rather than position, and checking how your result is actually rendering is a faster first step than rewriting anything.
Noise is the fourth and the most common on small accounts. A set with two hundred monthly impressions swings forty per cent on a handful of searches. Below a certain volume the percentage is a worse description of reality than the raw count, so report the count.
One discipline covers most of this. Compare year on year at set level, never call a two week movement, and when somebody asks about a spike, check whether it happened last year before you build a theory about it.
Reporting for a chain, where the average hides everything
On a multi store account there is one further failure, and it is the one that lets a serious problem run for two quarters without anybody noticing.
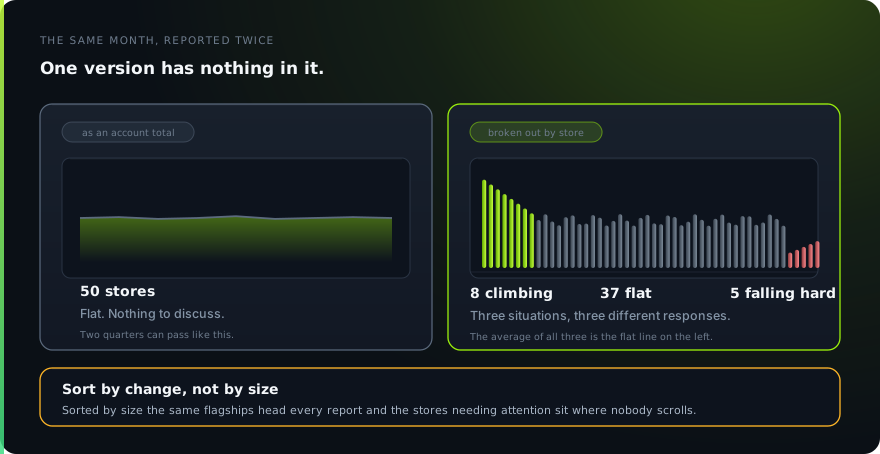
Fifty stores. Eight climbing, five falling badly, the rest flat. The account total is unchanged, the report says steady, and the five stores in trouble stay in trouble until somebody happens to look at one of them individually.
The fix is to stop reporting the account as a unit. Report per store, sorted by change rather than by size, and show both ends of the list. The top five and the bottom five in one view answer more questions than a total ever does.
Sorting by change rather than by volume matters more than it sounds. Sorted by size, the same four flagship stores head the report every month and the ones that need attention sit in the middle where nobody scrolls.
Two chain specific checks belong in the same view. Whether two stores in one market have started trading positions, which is module 03’s cannibalisation problem showing up as a reporting artefact.
And whether a store that fell has a profile problem rather than a page problem. Those two look identical in a traffic chart and need completely different work, so the check is worth running before anybody is dispatched to rewrite a page.
The practical constraint is the thousand row cap again. On a fifty store site, filter by page path per store and export in slices, or move to a bulk export. Reading a chain account through the standard table means reading the largest stores and nothing else.
The monthly report, and the four numbers in it
Most monthly reports fail in the same way. Twenty charts, no argument, and nothing that answers the only question the person paying has, which is whether this is working.
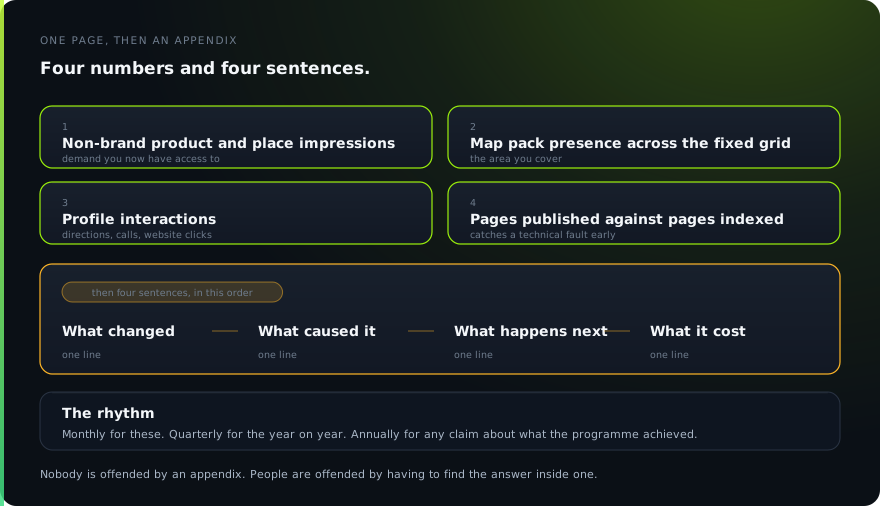
Four numbers carry a dispensary account. Non-brand product and place impressions, which is the demand you have gained access to. Map pack presence across the fixed grid, which is the area you cover.
Profile interactions, meaning direction requests, calls and website clicks together, which is the closest thing to intent that is actually counted. And pages published against pages indexed, which is the only one of the four that catches a technical problem before it becomes a traffic problem.
Then four sentences, in this order. What changed. What caused it. What happens next. What it cost. A report that answers those four in plain language will be read by somebody senior, and a report that opens with twenty charts will not.
When the client wants a rankings table anyway
Many will, and refusing outright reads as evasion. Give them one, and make it the version that is true: a fixed list of tracked queries, the grid point each pack position was measured from, and the previous month beside it.
Naming the measurement point on every pack row is what makes the table honest, and it does the teaching for you. After two months of seeing the same query at different positions from different points, nobody asks for a single rank again.
What stays out of that table is average position from Search Console. For the reason in section two it is describing the topmost result from the whole site, so putting it next to a tracked pack position invites a comparison between two numbers that measure different things.
Everything else belongs in an appendix that exists to be checked rather than read. Nobody is offended by an appendix. People are offended by having to find the answer inside one.
The rhythm matters as much as the format. Monthly for the four numbers and the four sentences. Quarterly for the year on year comparison and the strategy conversation. Annually for anything involving a claim about what the programme achieved.
That cadence is worth agreeing in the first week alongside everything else, and it is one of the reasons the phases an engagement actually runs in are worth setting out before any work starts rather than being discovered by the client one report at a time.
What to promise, and what to refuse
The pressure to promise something specific is higher in this industry than in most, and the reason is structural rather than personal.
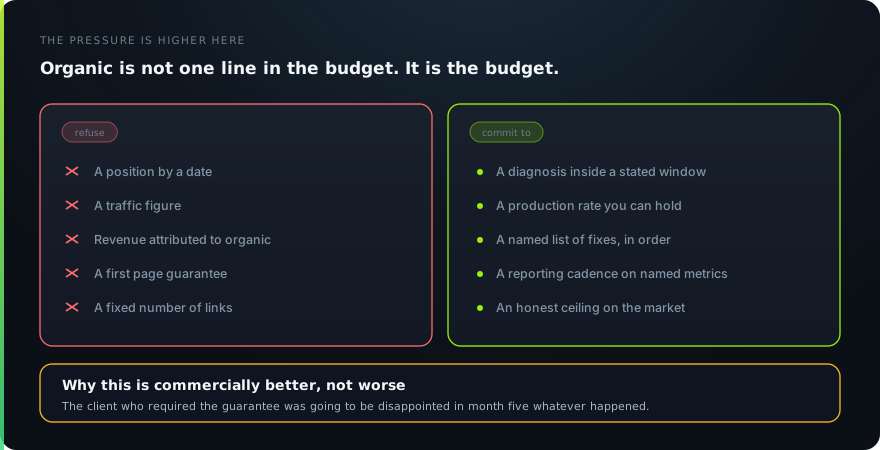
Because paid channels are closed, organic is not one line in a marketing budget. It is the marketing budget, which means the expectations that would normally spread across several channels all land on this one.
That is the same reason growth looks different when paid search is closed to you, and it is why the guarantee somebody else offered sounds so much more attractive to an owner in this category than it would in another.
Refuse a position by a date, because you do not control the results page. Refuse a traffic figure, for the same reason. Refuse revenue attribution on an account where the transaction happens on somebody else’s domain. Refuse a link count, for every reason in module 07.
What you can commit to is a diagnosis inside a stated window, a rate of production you can actually hold, a named list of fixes with an order, a reporting cadence on named metrics, and an honest ceiling on what the market allows.
The last one is the one people skip. Some markets are winnable and some are not worth the fee, and saying which before the contract is signed costs you occasional work and saves you the engagements that end badly.
This is commercially better than it sounds. The client who required the guarantee was going to be disappointed in month five whatever happened, and the ones who stay are the ones who wanted the honest version. That is roughly what every result published with its measurement window attached is meant to demonstrate.
A flat month, diagnosed in order
Sooner or later a month comes in flat and somebody wants an explanation the same day. Having an order to work through turns that into twenty minutes instead of an afternoon of theories.
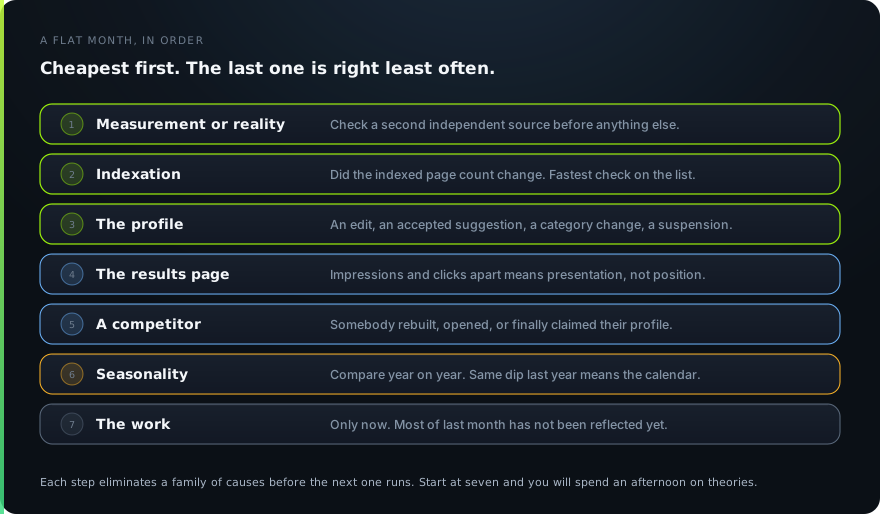
- Measurement or reality. Check a second independent source before anything else. If the profile interactions moved and the site data did not, you have a tracking problem rather than a search problem.
- Indexation. Did the number of indexed pages change. A quiet drop here explains most sudden flatness and is the fastest thing on the list to check.
- The profile. Did anything change on it. An edit, a suggested change accepted, a category altered, a suspension. Module 01 and module 02 both live here.
- The results page. Impressions and clicks moving apart means presentation changed rather than position, which points at the page around your result.
- A competitor. Somebody rebuilt, somebody opened, somebody finally claimed their profile. Look before assuming it was you.
- Seasonality. Compare year on year. If the same dip appears in the same month last year, the explanation is the calendar.
- The work. Only now. Most of what was published last month has not been reflected yet, and this is the answer people reach for first and the one that is right least often.
Step two deserves its own habit, because it is cheap and it catches the expensive things. Fetching the page the way a crawler does takes under a minute and rules out a rendering failure, an age gate change and a server error in one pass.
What done looks like, and what ongoing actually buys
The last thing worth measuring is whether the engagement should continue, and almost nobody in this industry will say that part out loud.
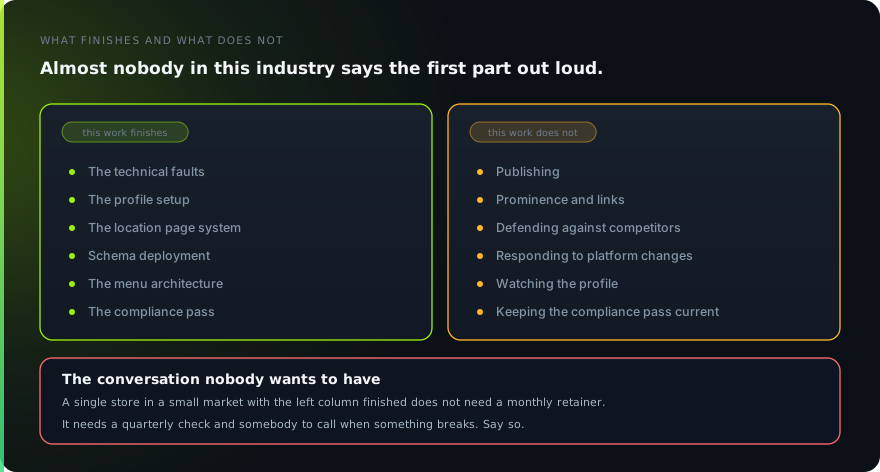
A large part of this work genuinely finishes. The technical faults get fixed once. The profile gets set up correctly once. The location page system gets built, the schema gets deployed, the menu architecture gets decided, the compliance pass gets run.
What does not finish is production, prominence, defence and platform change. Somebody has to keep publishing, keep earning mentions, keep watching competitors who are also working, and keep up with things Google alters without announcing.
So the honest version of an ongoing arrangement is a description of that second column, priced accordingly, rather than a retainer that quietly bills the first column for another year after it was completed.
Which produces the conversation nobody wants to have. A single store in a small market, with the finishable work done, does not need a monthly retainer. It needs a quarterly check and somebody to call when something breaks.
Saying that costs you an account and is the single most effective thing you can do for the ones that stay, because the clients who should be on a retainer stop wondering whether they are being managed or milked.
That is the set. The map pack and the profile, recovering when the profile is taken away, a content system that survives store fifteen, what you are allowed to say, and producing it at a rate you can hold.
Then making a crawler able to read the result, earning the prominence that decides the close calls, serving the second market that shares your address, and finally proving which of the rest of it actually did anything.
If you would rather have the whole programme run properly and reported the way this module describes, that is what an engagement covers, in phases, with the pricing stated, and the free audit produces the first version of the baseline in section seven at no cost.
Check your own site
Run the free check to see how your menu, age gate, and location pages appear to a search engine.